We all wish disasters didn’t happen and for most people living near a coastline, it’s only a matter of time before the next event. Added to this, climate change is accelerating the rate of severe weather events. We must become more dynamic, responsive, and ultimately predictive to them as we harden our infrastructure. That is why it is crucial to have timely data analysis that provides clear mission-oriented intelligence. This post explains how our tools enable users to perform their own analysis that increase the response time and accuracy for Humanitarian Assistance and Disaster Response (HADR) in times of crisis.
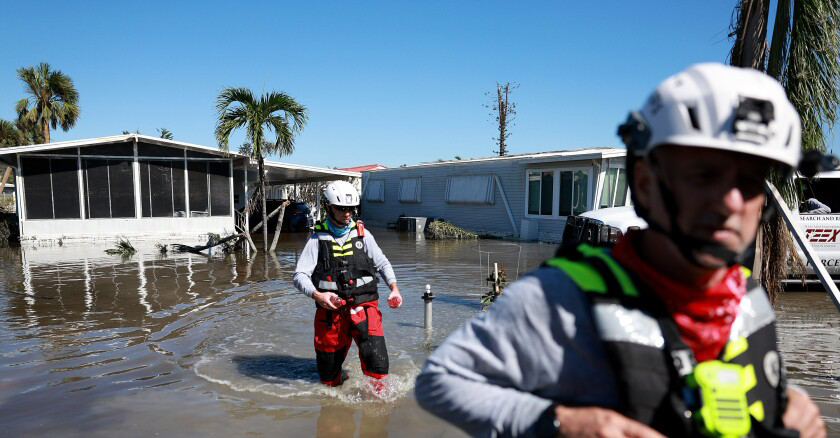
Hurricane Ian, 23 September 2022, West Florida Coast.
Hurricane Ian hit Florida and caused widespread damage and disruption typical for Category Five hurricanes. Over 20 inches of rain caused major flooding across the peninsula all the way to the Atlantic coast. Ian spent many hours slowly crossing Florida and emerged off the east coast as a tropical storm with peak winds around 70 mph during the late morning hours of September 29. Working with post storm high-resolution imagery we demonstrate the potential for Spectralytics to provide immediate damage assessments for First Responders, relief organizations, and residents displaced by the storm. Let’s go into the three steps needed to go from raw data to polished reports in under an hour. We will discuss developing an analysis engine, using it across a catalog of aerial datasets in parallel, and then using complementary analysis (Athena) to correlate damaged lots with property data from the County level. In the below steps, we scale the identification and classification of storm damage on infrastructure and residential areas.
Building an Engine
Pixel labeling and training
First we train an Analysis Engine to recognize the different types of damage. When building an engine you decide how you want to classify the image. This is a tricky and important decision to be considered carefully (we talk about it more in our documentation and tutorials), but for now we go with [Background, Building-Intact, Building-Damaged, Debris]. Users visually recognize building damages (roof-damage mostly) debris piles, and road damage from debris, water and sand. Here is how that looks in the annotation process where pixels are “painted” according to their damage labels. While most Artificial Intelligence (AI) tools require thousands of input examples, we annotated less than 10 segments of geotiffs like the one shown on the right. This aids in accelerating the response time for building new AI models. Once the annotations were complete (roughly 30-minutes), the analysis engine was trained and ready to use in under 20 minutes.
Using the Analysis Engine
Once we have an analysis engine ready, we simply make a Project combining the engine with the geotiffs for analysis and select “Run Analysis”. Our results were ready in just over 10 minutes.
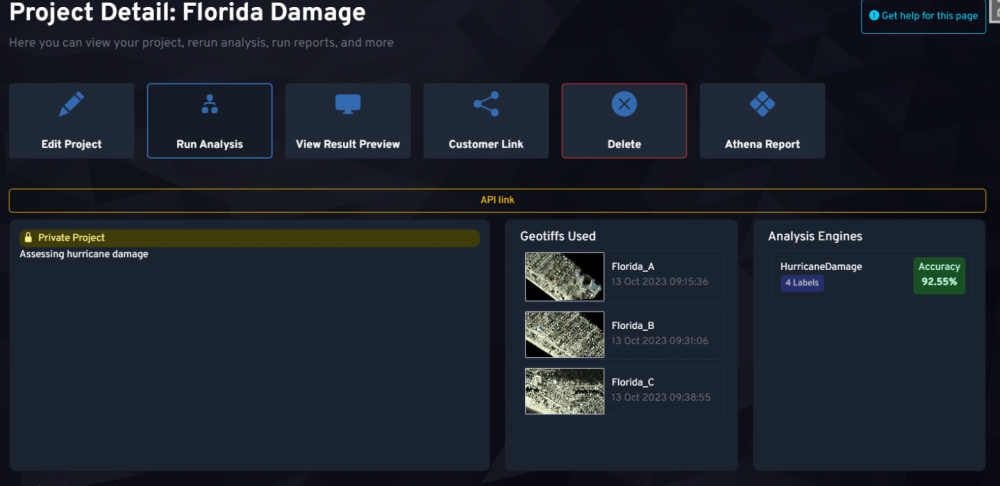
Spectralytics Project Page for Storm Damage Assessments
Results in a GIS Environment
Storm rooftop damage identification from Spectralytics Our results can be viewed online, or rendered in any GIS software – we use QGIS in this demo. Damaged buildings are shown in red. Intact buildings are shown in green. Debris is shown in blue. There are parts of these results that can be further improved, but for now they are sufficient to demonstrate the point of this blog post! Not that debris of interest is focused on lines of communication (Roadway) and that the analysis is first finding “rooftops”, then determining which are damaged.
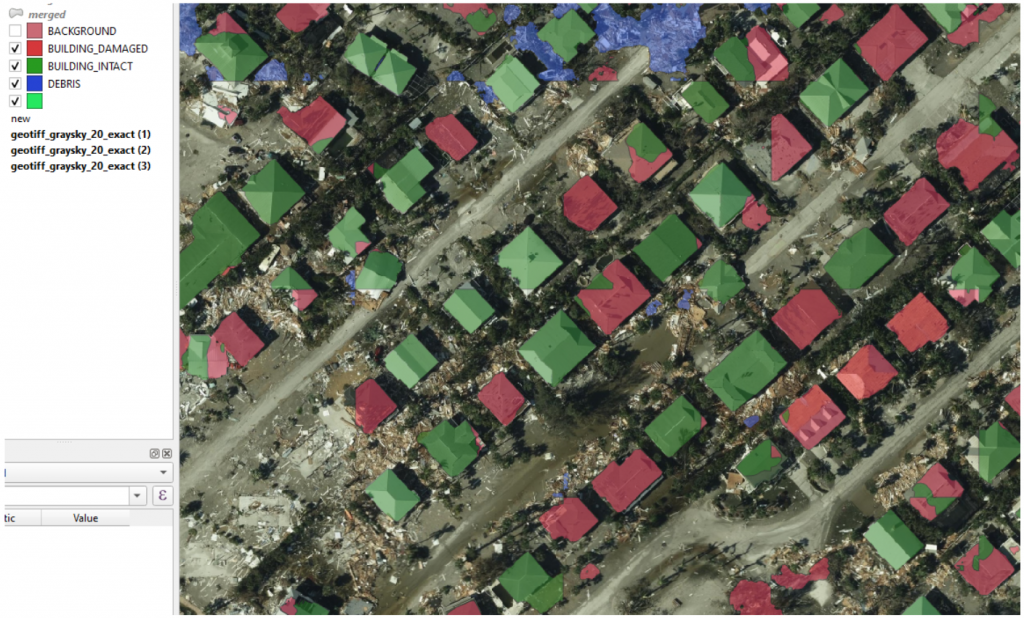
Storm rooftop damage identification from Spectralytics
Athena
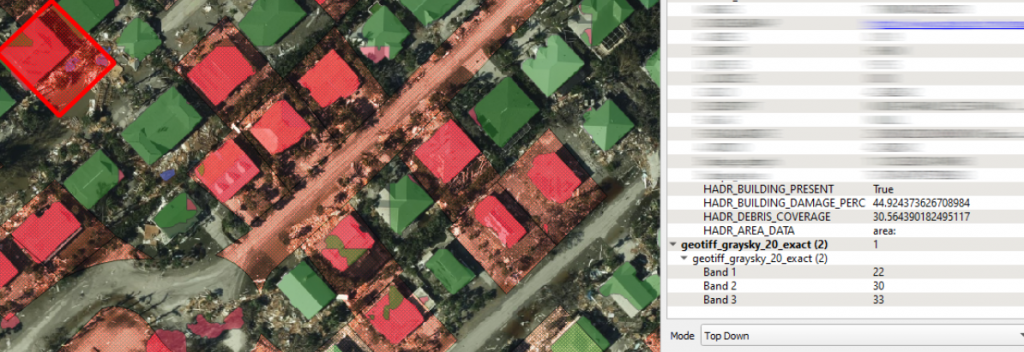
Even with the Shapefile produced by Spectralytics engines, there are often situations where additional analysis is desired. In our experience this is often very specific to a particular challenge or customer focus area. To make this fast and easy, we created Athena. Using Athena, Spectralytics support engineers can now develop custom processing of the data results for customers to use. In this case, we built a report in just a few hours which correlated the damage identified by our Analysis Engine with publicly available parcel datasets from FGDL (Florida Geographic Data Library). The customer simply fills in some selections and hits the “Run Assessment” button at the bottom. The results are processed within a minute or two and automatically downloaded. Below we render the results with a color-gradient, so now each parcel has a dotted overlay that has a more red color corresponding to more significant damage within the parcel.

Spectralytics Athena Report Generation
If we use the Identify tool in QGIS to select one of these parcels, you can see four properties prefixed with “HADR_” which have been added by the Athena report. Although this is a simple demo for this blog post, we hope it demonstrates the vast potential of Spectralytics and its Athena report to build timely and specific results.
Recent Comments